
Introduction
Every price move in the stock market begins before the trade executes. It starts in the order book, a live, constantly-shifting record of every pending buy and sell order. Market depth is the window into that hidden world. It tells you not just what a stock is worth right now, but how much buying and selling pressure sits just below and above the current price.
Whether you trade equities on the NYSE, futures on the CME, or want to understand how professionals read live market data, market depth is one of the most powerful tools available. This guide covers the meaning of market depth, how to read a depth-of-market chart, practical examples, and advanced strategies, from beginner fundamentals to institutional-level analysis.
Quick Answer: Market depth shows the volume of open buy orders (bids) and sell orders (asks) at every price level. A deep market has large order volume at many price levels, indicating high liquidity. A shallow market has thin order books and is prone to sharp price swings.
KEY TAKEAWAYS
• Market depth measures the volume of open buy and sell orders across price levels
• It is displayed as a depth of market (DOM) chart or live order book feed
• Deep markets = strong liquidity; shallow markets = higher volatility risk
• Traders use bid/ask imbalances to time entries, spot reversals, and avoid false breakouts
• Level 2 market data is the professional-grade version of market depth information
• Market depth is not a guaranteed predictor; it has well-known limitations, including spoofing
What Is Market Depth?
Market depth refers to the market's capacity to absorb large buy or sell orders without causing a significant price change. In practical terms, it is a real-time snapshot of all open limit orders sitting in an exchange's order book, showing exactly how many shares or contracts traders are willing to buy or sell at each price level.
The term depth of market (DOM) is used interchangeably with market depth and is especially common in futures and forex trading. The concept is the same: the more order volume clustered at and around the current price, the 'deeper' the market.
Why Market Depth Matters?
A stock with deep market depth can absorb a large institutional order without the price jumping dramatically. A thinly traded small-cap with shallow depth might move several percent on a single large order. Understanding depth helps traders:
• Gauge real-time supply and demand
• Identify price levels with strong buyer or seller interest
• Estimate slippage risk before entering a large position
• Detect potential support and resistance zones
Definition: Market depth = the total volume of open limit orders on both the bid side (buyers) and ask side (sellers) across all price levels in an exchange's order book at any given moment.
How Market Depth Works: Core Mechanics
To understand market depth, you need to understand how modern stock exchanges match orders. Every exchange operates an order matching engine, a system that pairs incoming buy orders with waiting sell orders and vice versa.
The Two Sides of the Order Book
The order book is divided into two sides:
• Bid Side (Buy Orders): All the limit orders placed by traders who want to buy. These are organized from the highest bid price (best bid) downward.
• Ask Side (Sell Orders): All limit orders from traders who want to sell. These are organized from the lowest ask price (best ask) upward.
The Bid-Ask Spread
The gap between the best bid and best ask is called the spread. For liquid large-cap stocks like Apple (AAPL) or Microsoft (MSFT), this spread may be just $0.01. For thinly traded small caps, it can be $0.10, $0.50, or more. A tight spread signals a healthy, liquid market.
Order Matching
When a new market order arrives, the exchange's matching engine immediately fills it against the best available price on the opposite side. A buy market order hits the lowest ask. A sell market order hits the highest bid. Every filled trade removes those orders from the book, causing the visible depth to shift in real time.
Order Type | Definition | Appears In Order Book? |
|---|---|---|
Market Order | Executes immediately at the best available price | No removes existing orders |
Limit Order | Executes only at a specified price or better | Yes creates visible depth |
Stop Order | Activates when the price reaches a trigger level | No hidden until triggered |
Stop-Limit Order | Limit order activated by a stop trigger | No hidden until triggered |
Understanding the Market Depth Chart
A market depth chart (also called a DOM chart or depth chart) visualizes the full order book. It typically takes one of two formats:
Format 1: The Ladder / DOM View
This is a vertical list of price levels with bid volume on the left and ask volume on the right. It updates in real time as orders are added, modified, or cancelled. This is the format used by professional traders on platforms like Bookmap, Sierra Chart, and IBKR's Trader Workstation.
Format 2: The Stacked Area Chart
This view plots cumulative bid volume as a green curve sloping left and cumulative ask volume as a red curve sloping right from the current price. Where both curves taper away from the centre, you can see how quickly liquidity thins out at extreme price levels. TradingView offers a basic version of this chart.
What You See on the Chart
• Current price: The centre point where bids and asks meet
• Price levels: Each row or point represents a specific price
• Order volume: The number of shares/contracts sitting at each level
• Walls: Unusually large orders that appear as tall columns or thick horizontal lines

Difference between market depth vs. order book vs. Level 2 Data
Term | What it shows | Whose use it | Availability |
|---|---|---|---|
Market Depth | Volume of open buy/sell orders by price level | All traders | Most platforms (basic) |
Order Book | The raw list of all pending limit orders | Active traders | Exchange & broker platforms |
Level 2. Data | Real-time full NASDAQ/NYSE order book feed | Day traders, institutions | Paid subscription /broker |
Time & Sale | Record of all executed trades (tape) | Scalpers, tape readers | Most active trader platforms |
Bid-Ask Spread | Price gap between best bid and best ask | All traders | Standard free on all platforms |

How to Read Market Depth: A Step-by-Step Guide
Reading market depth effectively is a skill that takes practice. Here is a structured five-step approach used by active US equity traders:
Step 1: Identify the Best Bid and Best Ask
The top of the bid side is the highest price any buyer is currently willing to pay. The top of the ask side is the lowest price any seller will accept. The difference between them is the spread. Start here every time you open a DOM.
Step 2: Spot Liquidity Zones
Scan the order book for price levels with unusually large volume; these are called 'walls' or 'floors.' A large cluster of buy orders below the current price acts as support. A heavy cluster of sell orders above acts as resistance. These zones often match up with round-number prices ($50, $100, $200) due to trader psychology.
Step 3: Measure Order Imbalance
Compare total bid volume to total ask volume within a defined price range. If buy-side volume significantly outweighs sell-side volume, the market has bullish pressure. This imbalance is one of the most predictive signals in short-term trading.
Step 4: Watch for Order Flow Changes
Market depth is not static; it changes second by second. Watch for orders suddenly appearing or disappearing at key levels. Large orders that materialize quickly near support often signal institutional interest. Orders that vanish right as price approaches them may be 'spoofed' (see Section 7).
Step 5: Confirm with Volume and Price Action
Never trade off market depth alone. Confirm what the order book is telling you with actual executed volume (from the tape or volume bars on a chart) and the direction of price action. A strong bid wall only matters if the price is actually respecting it.
Entered graphics
What Market Depth Reveals About the Market
Beyond individual trade setups, market depth provides a macro-level picture of market conditions. Here are the four key signals experienced traders extract from depth data:
Market Sentiment
A healthy, two-sided order book with roughly balanced volume on both bid and ask sides suggests neutral market sentiment. A heavily bid-side-dominated book signals bullish sentiment; an ask-heavy book signals bearish pressure.
Short-Term Price Direction
When large limit orders accumulate on the bid side faster than they do on the ask side, the price tends to move upward as sellers run out of orders. The reverse is also true. This is the core logic behind order flow trading strategies.
Liquidity Strength
Deep markets (high volume at many levels) absorb large trades without major price impact. Shallow markets amplify the effect of each trade. Before entering any position larger than your typical trade size, check whether the depth can support your order without excessive slippage.
Institutional Interest
Large institutions cannot hide their interest entirely. When a major fund begins buying or selling, order book patterns shift, sudden surges in bid depth at key technical levels, unusual volume at specific prices, or consistent absorption of selling pressure are all signs that informed money is active.
Advanced Market Depth Concepts
Buy Walls and Sell Walls
A buy wall is a single very large bid order (or cluster of orders) at a specific price level that temporarily prevents the price from falling further. A sell wall is the equivalent of the ask side. These walls attract attention from retail traders, but experienced traders treat them with skepticism. Large orders can be cancelled instantly.
Iceberg Orders (Hidden Liquidity)
Many institutional traders use iceberg orders that display only a fraction of the total order size in the visible book. For example, an institution wanting to buy 500,000 shares may only show 10,000 at a time. As each visible tranche fills, a new one replaces it. Identifying iceberg behaviour requires watching for consistent order replenishment at the same price level.
Spoofing and Fake Orders
Spoofing is illegal in US markets (prohibited under the Dodd-Frank Act and enforced by the SEC and CFTC) but still occurs. A spoofer places a large order on one side of the book to create the impression of demand or supply, then cancels before it executes. Recognizing spoofing requires watching for orders that appear and disappear rapidly as the price approaches them.
Liquidity Absorption
This occurs when a large order silently absorbs all the opposing orders at a given level without significantly moving the price. If you see price attempting to break through a resistance level multiple times but repeatedly failing despite what appears to be strong buying, institutional selling may be absorbing each push as a bearish signal.
Momentum Shifts
A sudden shift in the bid/ask balance from heavy bids to heavy asks or vice versa often precedes a directional price move. These shifts, especially when accompanied by a spike in executed volume, signal that the previously dominant side is losing control.

Market Depth Across Different Markets
Market depth concepts apply across virtually every traded market, but the mechanics and tools differ by asset class:
Market | Depth Visibility | Key Tool | Key Tool |
US Stocks (Equities) | Level 1 (free) / Level 2 (paid) | NASDAQ TotalView, IBKR TWS | NASDAQ Total View, IBKR TWS |
US Futures | Full DOM standard | Sierra Chart, NinjaTrader, CME Globex | Sierra Chart, NinjaTrader, CME Globex |
Forex | Interbank depth only | ECN platforms, cTrader | ECN platforms, cTrader |
Cryptocurrency | Full order book | Binance DOM, Coinbase | Binance DOM, Coinbase |
Real-World Example: Market Depth in Action
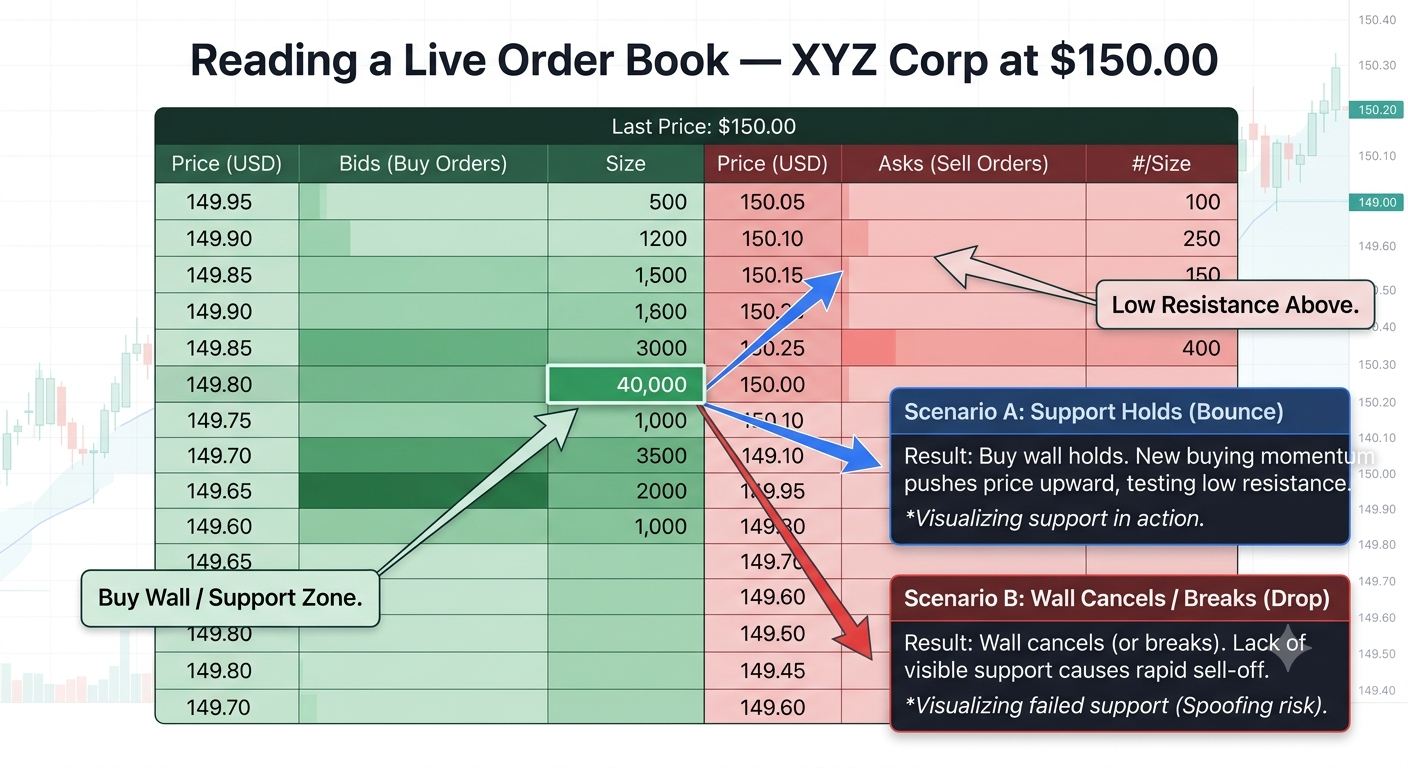
Let's walk through a realistic scenario using a hypothetical US large-cap stock, call it XYZ Corp, trading at $150.00:
The Setup
XYZ is trading at $150.00. The order book shows:
• Bid side: 25,000 shares at $149.95, 18,000 at $149.90, 40,000 at $149.80 (a visible buy wall)
• Ask side: 8,000 shares at $150.05, 6,000 at $150.10, 5,000 at $150.20
What a Trader Observes
The bid side is significantly deeper than the ask side. There is a large buy wall at $149.80 far more volume than typical for this stock. The ask side is thin, meaning even a modest wave of buying could push the price to $150.20 or beyond with little resistance.
The Trade Decision
A day trader using order flow analysis might interpret this as a bullish setup: strong buyer interest at $149.80 acts as a near-term floor, and the thin ask side suggests price can move up quickly with relatively small buying pressure. The trader might enter long at $150.00–$150.05 with a stop below $149.75 (just below the wall, in case the wall is fake).
What Happens Next
If the buy wall holds and ask-side orders continue to thin, price pushes to $150.20–$150.30. If the buy wall is cancelled (spoofed) as the price approaches $149.80, the stock drops quickly through that level, a bearish signal.
How Professional Traders Use Market Depth
Day Traders
Day traders monitor Level 2 data throughout the session to identify intraday support and resistance, confirm breakouts before entering, and manage position size based on available liquidity. They combine the order book with the time and sales tape to distinguish real fills from phantom orders.
Scalpers
Scalper traders who hold positions for seconds to minutes rely on market depth more than any other group. A scalper needs to know exactly how deep the book is at each tick price before executing. Even a $0.01 adverse slippage on a 10,000-share scalp is $100 in unexpected cost.
Institutional Traders
Large institutional desks use proprietary order flow algorithms that digest full market depth feeds in real time. These algorithms measure order book imbalance, track large order placement and cancellation rates, and attempt to detect other institutions' activity, all to minimize market impact when executing large orders.
Market Makers
Market makers continuously post both bid and ask quotes, profiting from the spread. They use advanced market depth models to manage their inventory risk and adjust quotes dynamically as order flow conditions change throughout the trading day.
Market Depth Limitations: What It Cannot Tell You
Market depth is powerful, but it is not infallible. These limitations are critical for any serious trader to understand:
• Spoofed Orders: Large orders can be placed and cancelled within milliseconds, creating a false impression of supply or demand. High-frequency traders exploit this constantly.
• Hidden Liquidity: Iceberg orders, dark pools, and off-exchange trades are invisible to the standard order book. The NYSE estimates that a significant portion of US equity volume now trades off-exchange in dark pools.
• Dark Pools: Major institutional trades often execute in private, off-exchange venues precisely to avoid showing their hand in the public order book.
• Rapid Cancellation: Modern trading algorithms can add and cancel thousands of orders per second. The order book you see at any moment is a snapshot of a rapidly changing and often manipulated landscape.
• No Directional Guarantee: Even a perfectly deep, one-sided order book is no guarantee of price direction. Macro news, earnings surprises, or a Federal Reserve announcement can obliterate any market depth signal instantly.
Risk Warning: Market depth should always be used as one signal within a broader trading strategy. Professional traders combine it with technical analysis, fundamental catalysts, volume analysis, and risk management frameworks, never relying on order book data alone.
Best Tools & Platforms for Market Depth in the US
Platform | Type | Market Depth Depth | Best For | Cost |
IBKR Trader Workstation | Full-service broker | Full Level 2 + order book | Active traders, institutions | Free with an account |
TD Ameritrade / thinkorswim | US retail broker | Level 2 NASDAQ | US retail active traders | Free with an account |
TradingView | Charting platform | Basic depth chart | Charts + basic DOM | Free / paid tiers |
Sierra Chart | Professional trading platform | Full DOM + order flow | Futures, professional traders | Subscription |
NinjaTrader | Futures/forex platform | Full DOM + analytics | Futures day traders | Free / paid tiers |
Bookmap | Specialized order flow tool | Heatmap order book | Advanced order flow traders | Subscription |
Market Depth Strategies Used by Traders
Breakout Confirmation
Before entering a breakout trade, check whether the depth above resistance (or below support) is thin or deep. A thin ask side above resistance means a breakout could accelerate rapidly, favourable for momentum buyers. Heavy selling above resistance increases the probability of a failed breakout.
Reversal Detection
When price approaches a large buy wall, and order flow shows heavy selling being absorbed without the price breaking down, a reversal may be imminent. Similarly, rapid accumulation of bid-side volume at a key support level, confirmed by fewer sell executions on the tape, signals potential upside reversal.
Liquidity Hunting (Stop Hunts)
Sophisticated traders recognize that large institutions often probe just beyond obvious support and resistance levels to 'hunt' stop-loss orders before reversing. Watching the order book for sudden depth withdrawal at a key level, followed by a sharp move through it, and immediate return, identifies these liquidity hunt patterns.
Scalping with DOM
A pure scalp setup: wait for a large bid order to appear at a price level, enter long just above it, and exit when the bid order starts to thin, or the spread widens. This requires sub-second execution and direct market access but remains a core strategy for professional scalpers at US prop trading firms.
Common Mistakes Traders Make with Market Depth
• Treating every large order as real: Not all walls hold. Many are spoofed. Confirm wall strength by watching whether the order persists as the price approaches it.
• Ignoring the broader trend: A bullish order book in a strong downtrend is a dangerous contrarian signal. Always trade depth signals with, not against, the prevailing trend.
• Using depth alone without tape confirmation: The order book shows pending orders; the tape shows actual executions. Both together give the full picture.
• Overtrading on DOM signals: Market depth changes rapidly. Chasing every flicker in the order book leads to overtrading, excessive commissions, and emotional decision-making.
• Neglecting news and catalysts: A perfectly bullish order book is useless if the company is about to release negative earnings. Market depth cannot predict fundamental catalysts.
Beginner's Guide: How to Start Using Market Depth
If you are new to order book analysis, here is a practical learning path:
1. Open a free TradingView account and enable the depth chart on any liquid US stock. Simply observe, do not trade. Watch how the curves shift as the price moves.
2. Open a paper trading account on thinkorswim (TD Ameritrade) or IBKR and enable Level 2 data. Practice reading the ladder view in simulated real-time.
3. Learn to combine Level 2 with the time and sales window. Identify when large prints on the tape correspond to order book movements.
4. Study the order books of highly liquid stocks first: Apple, Microsoft, SPY. Their order books are deeper and easier to read than thin small-caps.
5. Move to live trading with small position sizes only after you can consistently identify bid/ask imbalances, walls, and order flow shifts on paper.
6. Layer in technical analysis. Market depth is most powerful when it confirms what your chart already shows, not when it contradicts a clear trend.
FREQUENTLY ASKED QUESTIONS
What is market depth in trading?
Market depth in trading is a real-time measure of the volume of open buy and sell orders at every price level in an exchange's order book. It shows how much supply and demand exist at prices above and below the current market price, giving traders a picture of short-term liquidity and potential price movement.
How do you read market depth?
To read market depth, open a Level 2 or DOM view and identify the best bid (highest buy order) and best ask (lowest sell order). Then look for areas of heavy order concentration; these are potential support (large bids) and resistance (large asks) levels. Compare total bid volume to ask volume to gauge which side has more pressure.
What is the difference between market depth and the order book?
Market depth and order book refer to the same data presented differently. The order book is the raw listing of every pending limit order by price and quantity. Market depth is typically a visual representation (chart or ladder) of that data, showing the cumulative volume available at each price level. In practice, traders use the terms interchangeably.
Is market depth a reliable trading signal?
Market depth is useful but not reliable in isolation. Its main weakness is that orders can be spoofed, placed and cancelled before execution to mislead other traders. Dark pools and iceberg orders also hide a significant portion of real market activity. Use market depth as one of several tools, combined with technical analysis and volume confirmation.
What is a buy wall in market depth?
A buy wall is a large concentration of buy limit orders at a specific price level that appears to act as support. It suggests strong buyer demand at that price. However, a buy wall can be a spoof, a deceptive large order placed to create the impression of support, but cancelled before the price reaches it. Always confirm a wall by watching whether it holds as the price approaches.
What is Level 2 market data?
Level 2 market data is the full, real-time order book data provided by exchanges like NASDAQ and NYSE. It shows all pending buy and sell orders beyond just the best bid and ask (Level 1). In the US, Level 2 access typically requires a subscription or an active brokerage account. It is the foundation of market depth analysis for active traders.
Can market depth predict price movement?
Market depth can indicate short-term price direction based on order imbalances and liquidity levels, but it cannot predict price movement with certainty. Large orders can be cancelled, fundamental news can override technical signals, and institutional algorithms can shift conditions instantly. It is best used as a probability-enhancing tool, not a prediction system.
What is the depth of market (DOM)?
Depth of market (DOM) is a trading interface that displays the live order book as a vertical price ladder, showing bid volume on one side and ask volume on the other. It is the primary tool used by futures and professional equity traders to monitor market depth. Platforms like Sierra Chart, NinjaTrader, and IBKR TWS all offer DOM views.
Conclusion
Market depth is one of the most transparent windows into short-term supply and demand dynamics in financial markets. By learning to read the order book, identify liquidity zones, and recognize order flow patterns, traders gain a genuine informational edge, particularly in fast-moving markets where price action alone tells an incomplete story.
That said, market depth is not a crystal ball. Spoofing, dark pools, and hidden orders mean the visible book is always a partial and sometimes deliberately misleading picture. The traders who use market depth most effectively are those who treat it as one piece of a broader analytical framework, combining it with price action, volume analysis, technical levels, and disciplined risk management.
Whether you are just learning to read a Level 2 screen or looking to incorporate advanced order flow analysis into your trading strategy, start with the fundamentals: understand the bid and ask, learn to spot imbalances, and always confirm what the book says with actual executed volume.